

We’ve been publishing our Australia at Work monthly infographics for a few years now and while there are always little movements in the data, until 2020, there was hardly any earth shattering news. However, we already know that this year is dramatically different and so we thought it will be interesting to look at information over a three-month period to see how the job market has been responding to the challenges delivered by the pandemic. You can download each of the complete infographics from the links at the foot of this article and we are sure that you will find some specifics that interest you.
In looking at the 1st quarter of the new financial year we start to develop a picture of how the job market will be shaping up headed into the future, despite the fact that this period covers most of the severe lockdown in Melbourne.
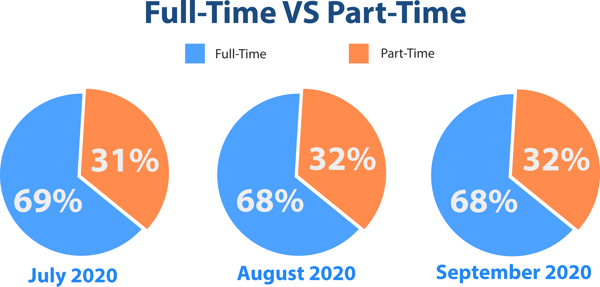
The 1st thing of note is that the balance of full-time and part-time work has barely changed with 68% of work being full-time and 32% being part-time.
Overall employment was a little down in September at 12.571 million people from an August high in the 12.583 million people.
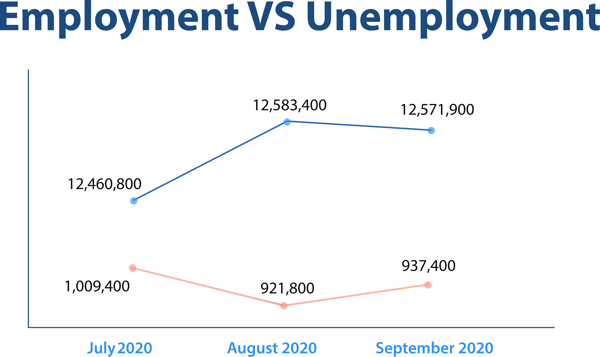
In July, unemployment was sitting at over a million people and has now fallen to 937,000. During the quarter, it is very noticeable that Victoria’s participation rate fell from 64.6% to 63%
| State | Participation Rate | ||
| July 2020 | August 2020 | September 2020 | |
| Northern Territory | 72.7% | 73.4% | 70% |
| Queensland | 63.9% | 63.6% | 65.5% |
| New South Wales | 64.8% | 65.2% | 65.4% |
| Australian Capital Territory | 71.5% | 73.1% | 72.7% |
| Tasmania | 60.3% | 61.1% | 61.1% |
| Victoria | 64.6% | 63.9% | 63% |
| South Australia | 61.8% | 62.8% | 62.5% |
| Western Australia | 67.2% | 67.9% | 67.7% |
However, at the time of publishing the quarterly release of who works in which industries was not available and while we don’t expect healthcare to fall it is hard to imagine that we are not going to see a significant drop in retail which has for some time been almost 10% of the Australian workforce.
What is also clear is that as they brought the pandemic under control, both New South Wales and Queensland have had a generally upward trend in the numbers of people employed while South Australia and Western Australia had relatively uninterrupted increases in jobs. Is also been encouraging to see the volume of unemployed women fall by around 50,000 jobs across the quarter. There is still underlying strength in the job market.

It is fair to say that we are holding our breath for Victoria as its economy is in the early days of getting back to work and it had shed at least 80,000 jobs across the quarter. If the rest of the country is anything to go by, the new found infection controls and freedoms in Victoria, along with an overnight change in consumer and business sentiment suggest that we would expect to see Victoria get back onto a job growth curve relatively quickly. This is also supported by relative improvements in job advertisements which are still down on last year but which are edging closer to where they were.
We hope you find the infographics of interest - feel free to share them widely
.jpg "buss report 2025 (1)")